How to self-host Grafana on your own VPS without Docker
Run Grafana v13.2.4 on your own Ubuntu server with ox and no Docker: Postgres, a yarn frontend build and a Go build, from the config that ran.

To self-host Grafana you need an Ubuntu server, a fork of the Grafana repo with one ox.toml file in it, and ten variables. In our run the first deploy took about 18 minutes, most of it the build, and ox set up the Postgres database Grafana stores its data in.
How we tested On Oct 17, 2026, ox deployed Grafana v13.2.4 from commit af4a33e3 on a fresh DigitalOcean server with 8 vCPUs and 16 GB of memory. The run then redeployed it, backed it up and rebooted the server. Then a separate test agent, one that did not write the config, signed in, added a data source, saved a dashboard with a chart, and saw it drawn after a reload, and checked the app's services and its backup.
Grafana is an open-source platform for monitoring and observability. It reads metrics, logs and other data from data sources such as Prometheus, Loki or PostgreSQL, draws them as panels on dashboards, and can send alerts on top. The code is under the AGPL-3.0, with Apache-2.0 for a few folders. It is a Go server with a large TypeScript frontend. Dashboards and users live in a database, which is a SQLite file unless you point Grafana at MySQL or Postgres.
ox deployed Grafana v13.2.4 (commit af4a33e3) on Oct 17, 2026 on a fresh DigitalOcean server with 8 vCPUs and 16 GB of memory; the first deploy took 18 minutes and a redeploy took 8 minutes.
- First deploy: 18 minutes, from adding the project until the app passed the run's first checks.
- Redeploy of the same commit: 8 minutes, until the app passed the checks again.
- Server: DigitalOcean, 8 vCPUs and 16 GB of memory (
s-8vcpu-16gb), with this app alone on it. Every one of the 85 apps we deployed ran on this one size, so it was not picked for this app. - Memory in use after the reboot: 888 MB of 15986 MB, for the whole server: Ubuntu, the app, its services, Caddy and the ox agent. On a server with no apps, ox's tests on real servers hold the agent to 40 MB or less and Caddy to 50 MB or less.
- Services ox runs for it:
postgres. - Source: github.com/grafana/grafana at v13.2.4, commit
af4a33e3.
What you need
An Ubuntu LTS server that can reach the internet. The run used the size in the facts above and measured the memory there.
A GitHub account to fork
grafana/grafana, and an ox account, which you open by signing in with GitHub.No outside service. Grafana has no mail server set here, so the "Forgot your password?" link and email invites send nothing. Email was not tested.
The steps
Choose Add a server in the ox dashboard and run the command it shows, as root, on your Ubuntu machine. It installs the ox agent and Caddy.
Fork grafana/grafana on GitHub and check out the tag v13.2.4, the release the run deployed. Add the ox.toml shown below at the root of the repo, then commit and push. Next write a file named grafana.env on your laptop with a value for each of the ten keys in the variables section. With the ox CLI signed in, run:
ox new <you>/grafana
ox review grafana --from-file grafana.env --wait
ox names the project after the repo. The review saves the values and starts the first deploy, and --wait prints the run until it ends. In the browser the same two steps are New project and the review screen, as the quickstart shows.
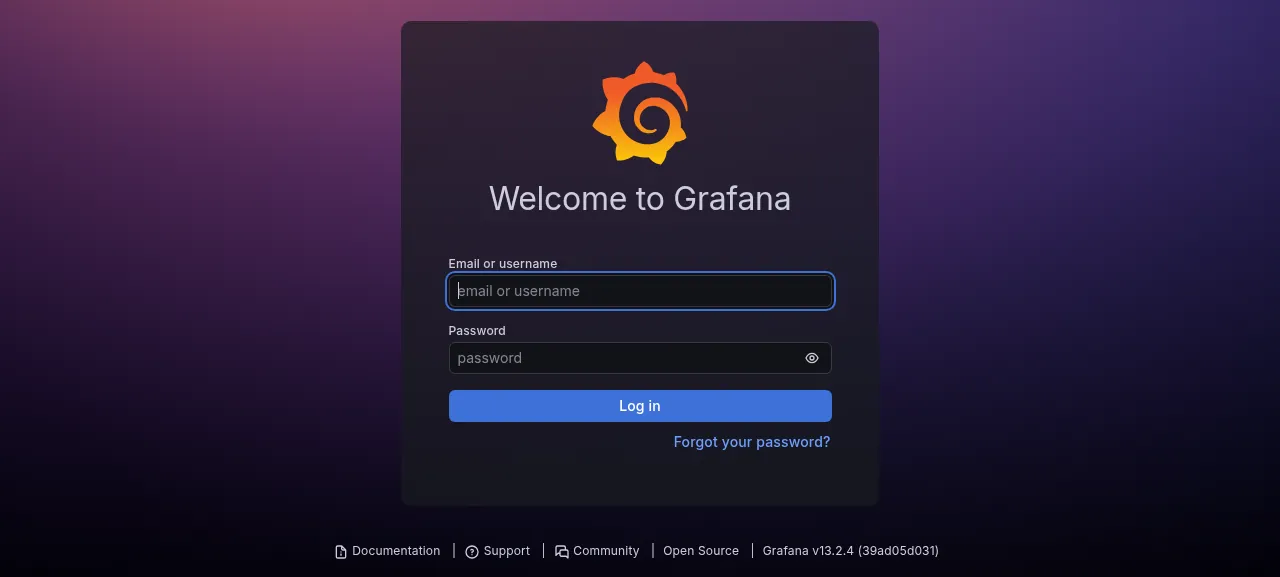
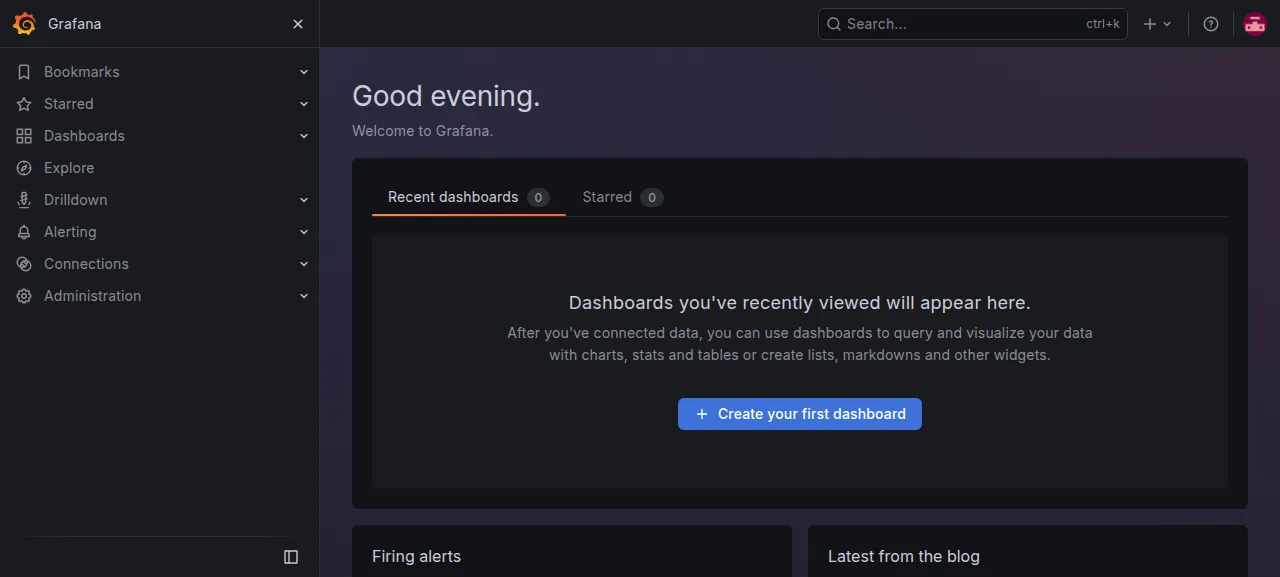
When the deploy is green, open the address ox shows for the project and sign in with the admin name and password you set. The first page load takes a few seconds. The run then added a data source and a dashboard:
Open Connections, then Data sources, then Add new data source, and pick TestData. Press Save & test. It answers that the data source is working.
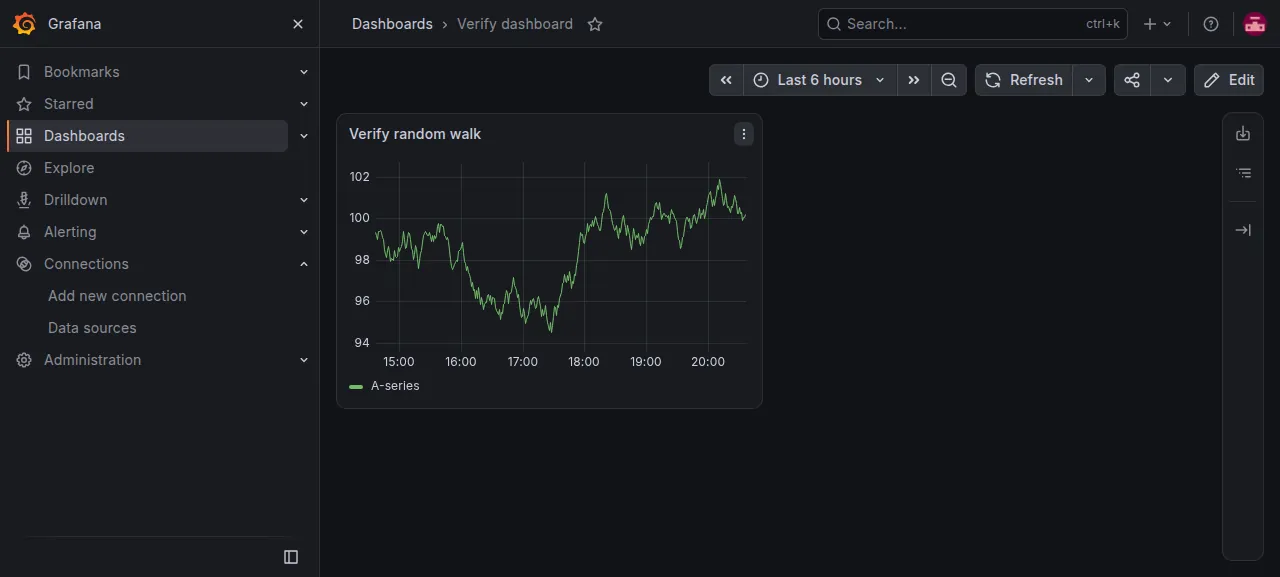
Open Dashboards, then New, then New dashboard, then Add visualization, and pick TestData. The panel draws a random walk line at once.
Give the panel a title, save the dashboard under a name, reload the page and open Dashboards. The dashboard is listed, and it opens with its chart drawn.
The run served Grafana on that preview address only. A domain of your own was not part of it, and the domains page covers how ox adds one.
The ox.toml, line by line
# Grafana as the root Dockerfile builds it: `yarn run build` for the frontend,
# `make build-go` for the server, then `grafana server` as
# packaging/docker/run.sh starts it. Settings come from GF_* variables.
packages = ["make"]
# Grafana makes its first admin at start from these two, and sign-up is off.
required_variables = ["GF_SECURITY_ADMIN_USER", "GF_SECURITY_ADMIN_PASSWORD", "GF_SECURITY_SECRET_KEY"]

[app]
# The home path must be absolute: Grafana finds its core plugins under
# <home>/public only then. Its search index may not be shared by two running
# copies, and ox starts the new release beside the old one, so each release
# keeps its index in its own folder (Grafana rebuilds it from the database).
start = """exec ./bin/grafana server --homepath="$PWD" \
  cfg:server.http_addr=127.0.0.1 \
  cfg:server.http_port="$PORT" \
  cfg:unified_storage.index_path="$PWD/.search-index" \
  cfg:default.log.mode=console"""
health = "/api/health"

[build]
# Yarn 4: --immutable is the recipe's install.
install = "yarn install --immutable"
commands = [
  "yarn run build",
  "make build-go GO_BUILD_TAGS=oss WIRE_TAGS=oss COMMIT_SHA=\"$OX_RELEASE\"",
]
# Grafana migrates as it starts; its own commands run them first, so a first
# deploy's hundreds of migrations stay out of the start's health wait.
migrate = """./bin/grafana cli --homepath "$PWD" admin db-migrate cfg:default.log.mode=console \
  && ./bin/grafana cli --homepath "$PWD" admin resource-db-migrate cfg:default.log.mode=console"""

[services]
postgres = {}

[storage]
# [paths] data in conf/defaults.ini: installed plugins and file state.
keep = ["data"]

[tools]
# mise.toml reads this from go.mod with a template; the Dockerfile pins it.
go = "1.26.9"
packages = ["make"]installs make, which Grafana's Go build runs through.required_variablesnames the three keys ox asks for before the first deploy: the admin name, the admin password and the secret key. Left out, Grafana would fall back to its public defaults, including the loginadminwith the passwordadmin.startrunsgrafana serveras the Dockerfile's run script does. The home path must be absolute: Grafana finds its core plugins underpublicin that folder only then. Thecfg:settings bind the server to127.0.0.1and the port ox gives it, and send its log to the console, where ox collects it. The last setting gives each release its own search index folder. Two running copies may not share an index, and ox starts a new release beside the old one.healthis/api/health, Grafana's own check. ox switches traffic to a new release once it answers.installrunsyarn install --immutable, which fails instead of changing the lockfile. Thecommandsbuild the frontend withyarn run build, then the server withmake build-go.GO_BUILD_TAGS=ossandWIRE_TAGS=ossselect the open-source build.COMMIT_SHAstamps the release's commit into the version the help menu shows.migrateruns Grafana's two migration commands from its own CLI. A first deploy applies hundreds of migrations, and this keeps them out of the start's health wait.[services]asks for Postgres.[storage]keeps thedatafolder across deploys, where Grafana puts installed plugins and file state.[tools]pins Go to the version the Dockerfile uses, because the repo'smise.tomlreads it fromgo.modwith a template.
There are no workers. The config declares one process, and the only unit on the server is the app's own.
GF_DATABASE_TYPE
GF_DATABASE_HOST
GF_DATABASE_NAME
GF_DATABASE_USER
GF_DATABASE_PASSWORD
GF_SERVER_ROOT_URL
GF_SERVER_DOMAIN
GF_SECURITY_ADMIN_USER
GF_SECURITY_ADMIN_PASSWORD
GF_SECURITY_SECRET_KEY
Grafana reads any setting from a variable named GF_<SECTION>_<KEY>.
The five
GF_DATABASE_keys switch the database from SQLite to Postgres.TYPEispostgres.HOSTholds the host and port together, as Grafana's docs write it.NAME,USERandPASSWORDare the database, role and password. The run set the last four with references to the Postgres ox sets up:${postgres.host}:${postgres.port},${postgres.database},${postgres.user}and${postgres.password}, so no database password is typed by hand. See variables for how references work.GF_SERVER_ROOT_URLandGF_SERVER_DOMAINare the project's address, which Grafana builds its links and redirects from. They are${PUBLIC_URL}and${PUBLIC_HOST}, filled in by ox, so they follow the address when it changes.GF_SECURITY_ADMIN_USERandGF_SECURITY_ADMIN_PASSWORDare the first admin. Grafana has no sign-up page, becauseallow_sign_upis off by default.GF_SECURITY_SECRET_KEYencrypts the passwords and secrets stored in data source settings. Grafana ships a default that sits in its public repo, so set a random string of your own.
Postgres and failed logins
Postgres is shared with other apps on the server, each with its own database and user. You can look inside it from the Services tab, or with ox explore grafana postgres. Five wrong passwords in a row lock that login for five minutes.
Updates and backups
To move to a new release, merge its tag into your fork and push, or run ox deploy grafana --wait. ox builds the new release beside the running one and runs the migrations before it takes traffic. Before them it dumps Postgres, and the run's backup list holds that dump. Read Grafana's release notes before a major version.
Run ox backups grafana to list backups. The run's backup, made with Back up now, held a Postgres dump and an archive of the data folder. A restore was not tested. The backups page covers keeping copies in an S3 bucket, and self-hosting with ox lists the other apps ox has deployed.
Frequently asked questions
Do I need Docker to self-host Grafana?
No. Grafana documents a Docker image, but it is a plain Go server and a yarn frontend. ox builds both from your fork on the server and runs the result as a system service, with Postgres installed beside it. No image is pulled, and an update is a push to your fork or one deploy command.
Which database does self-hosted Grafana need?
Grafana stores its dashboards and users in SQLite by default, and its docs say SQLite is not recommended for production. They suggest MySQL or Postgres instead. This setup uses Postgres, switched on with five GF_DATABASE variables, and ox backs it up with a dump before each migration and on Back up now.
How do I make the first Grafana admin?
Set GF_SECURITY_ADMIN_USER and GF_SECURITY_ADMIN_PASSWORD before the first deploy, then sign in at /login. Grafana's docs say the password is set once on first run, so changing the variable later does not change it. Change it in your profile instead. Adding more people needs an admin, since there is no sign-up page.
How much memory does self-hosted Grafana use?
On the run's server, the whole machine used the memory the facts show after a reboot. That counts Grafana, Postgres, Caddy and the ox agent. It does not cover the build, which ran earlier on the same server. ox takes any server from 1 GB up, and says so when memory is why an app stopped.
Why is Prometheus missing from the data source list?
Right after the first deploy, Grafana downloads its suggested plugins from grafana.com in the background, about 500 MB, and that takes a minute or two. Until it ends, Prometheus, Loki and PostgreSQL are not listed, and the log says once that the Prometheus plugin is not found. TestData and the built-in Grafana source are there from the start.
New to running apps on your own server? How ox self-hosts your apps shows what ox sets up on your server.